

Two practices can report the same 52-day average and be in completely different trouble. The distribution is where the money is.
Days in A/R is the number most practice owners can quote from memory. It is also an average, and averages hide exactly the thing you need to see.
Take two practices, both reporting 52 days. The first has 8 percent of its receivables sitting beyond 90 days. The second has 31 percent. The first has a normal revenue cycle with some slow payers in it. The second has a structural problem that is being masked by a healthy front end paying quickly enough to pull the average down.
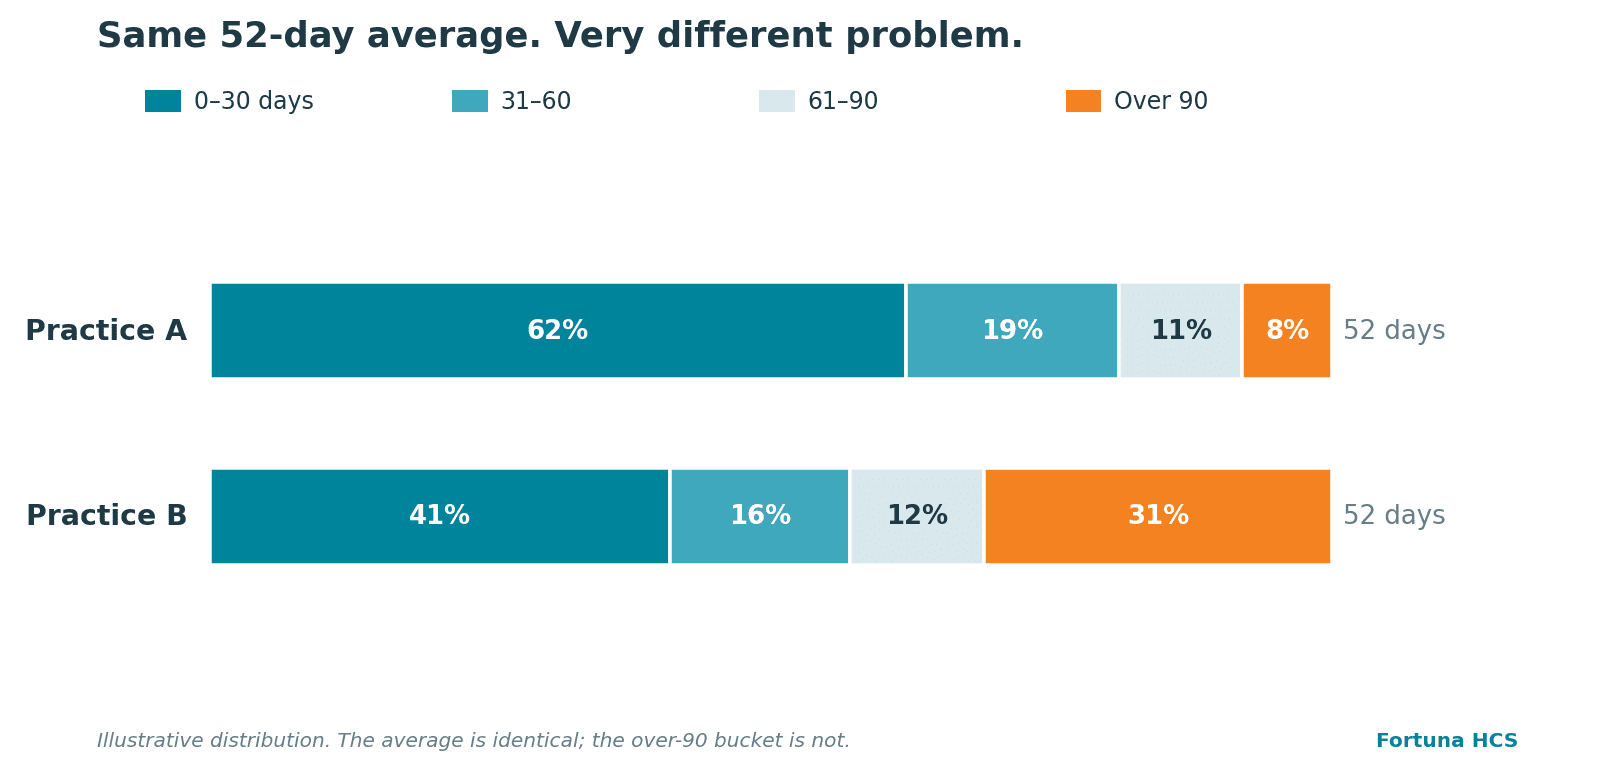
Read the Buckets, Not the Average
Pull your aging as a percentage of total A/R in four buckets: 0 to 30, 31 to 60, 61 to 90, and over 90. The over-90 bucket is the one that matters, because receivables rarely improve with age. Money that has sat unworked for three months is usually written off later and recorded as a contractual adjustment, which means the loss never appears as a failure.
We use 20 percent of total A/R as our own operating trigger for the over-90 bucket. It is not an industry standard and it is not a target. It is the point at which we stop treating the aging as a collection of individual slow claims and start looking for the system that is holding them.
Then Split It by Payer
An aging report at the practice level tells you that you have a problem. An aging report by payer tells you where it is. The pattern is almost always concentrated rather than spread evenly.
- One payer dominates the over-90 bucket. Usually an enrollment or linkage issue, a change in submission requirements, or a policy change nobody read.
- Patient balances dominate. A front-end collection problem, not a payer problem, and it needs a different fix entirely.
- One provider dominates. Frequently a credentialing gap, or claims going out under the wrong NPI.
- Spread evenly across payers. Capacity. Nobody is working the bucket, whether that is your staff or your billing vendor.
The Questions Worth Asking This Week
What percentage of total A/R is over 90 days, excluding patient responsibility? Which payer holds the largest share of it? When was each of those claims last touched, and by whom? If nobody can answer the third question from a report, that is the finding.
What Usually Fixes It
Aging buckets need named owners. Not a team, a person, with a target and a weekly review that looks at movement between buckets rather than at the total. If your billing is outsourced, this applies to the vendor as well. Ask for aging by payer and bucket, ask what was worked last week, and ask which claims are approaching timely filing. A vendor who cannot produce that in a day is not managing your A/R; they are submitting your claims.
The Operator’s Check
| Measure: | A/R over 90 days as a percentage of total A/R, by payer |
| Owner: | RCM lead, or the billing vendor where billing is outsourced |
| Cadence: | Weekly |
| Red flag: | The bucket grows across two consecutive reviews, or claims in it show no recent activity |
You do not need another report telling you that something is wrong. We help identify the operational cause, build the solution, and stay accountable for the result. The assessment fee is credited against your first invoice if you engage us.